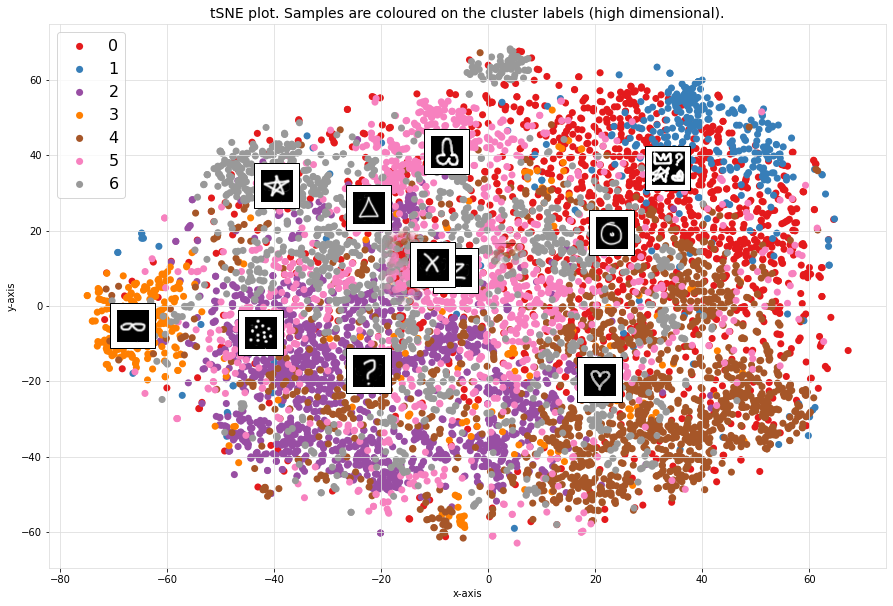
Semiotic clusterization diagram in Crowd Sign: Emission (t-SNE method). Russian ver. of article here


During the Art for the Future Biennale at the MAMM Museum (Moscow), big data of the symbols entered by the audience was collected.
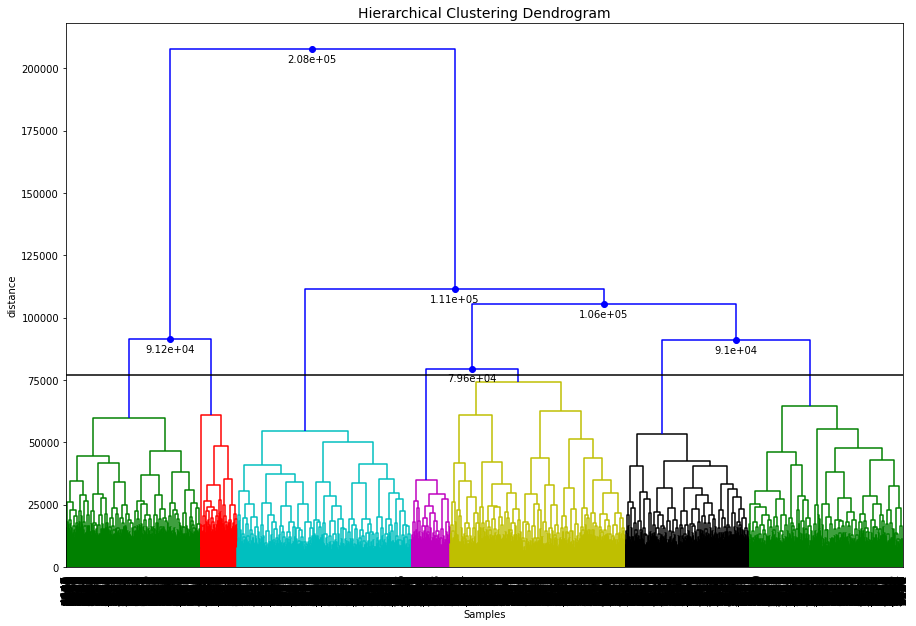
The result has an anonymized set of information that was subjected to research: clustering, grouping with the allocation of the main features.
Then were created a visual charts. These charts seems extremely interesting.
By analyzing the 8,000 signs created by the audience as they interacted with the game experience Crowd Sign : Emission,
the most repetitive symbols were selected and sets were formed from them, arranged in a big cloud of signs. In general, there were about 7 main zones.
The first two zones, the ‘heart zone’ and ‘penis zone’, are the longest and densest; they dominate all the others.
At the same time, the ‘heart zone’ is larger than the ‘penis zone’ by twice. Next are middle-size areas of circle-like signs
(these are various circles, spirals, arcs, and scrolls). These signs are popular because of their biomechanical appeal.
(perceptually, the body is more prepared for such signs, and the motivation to produce them is unconscious).
Next highest numbers is ‘star zone’ and ‘question mark zone’.
The sign of infinity zone joins them as a dense island. Next come the ‘triangle signs zone’ , the ‘X zone’ and ‘Z zone’
(probably the sign of the special operation in Ukraine). To the south west are the areas of plus and cross signs (crosses of all possible forms).
An extremely interesting and dense cloud is in the northeast. This cloud has a complex, figurative shape.
These forms contain a genuine and creative desire to transmit much more information than the work allowed,
and as a result very curious symbols were born, no longer just signs, but entire pictorial objects.
The above zones are joined by text glyphs, various messages, sometimes frivolous or obscenic.
Often these are very original signs that visually flow through all the main cloud fronts of the diagram.
An attentive and detailed eye can notice surprising intersections and dependencies in this semiotic map of the Russian empire of signs
(An allusion to Roland Barthes Empire of Signs).
In conclusion, I suggest the following semiotic clusterization diagram.
It allows you to easily zoom and pan, and the existing markers help assess the approximate location of the main zones of signs.
I hope that the exploration of this chart-map will lead the researcher to interesting conclusions.
email: grifgont@gmail.com
t-distributed stochastic neighbour embedding (t-SNE) is a statistical method for visualizing high-dimensional data
by giving each datapoint a location in a two-dimensional map.
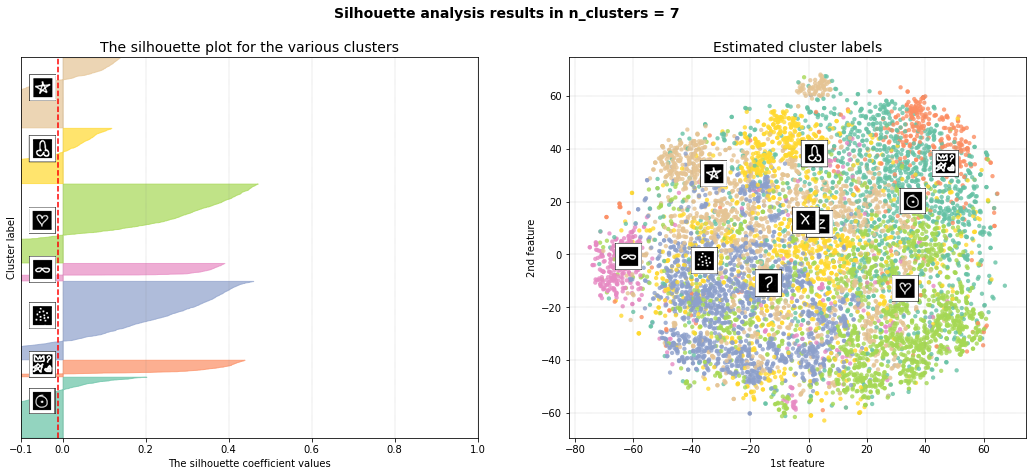
Silhouette refers to a method of interpretation and validation of consistency within clusters of data.
The technique provides a succinct graphical representation of how well each object has been classified.
Clustering tools: https://erdogant.github.io/clustimage/pages/html/Abstract.html
©2022 Mikhail Maksimov http://dying.fun